Of the 1400 English attractions surveyed VisitEngland’s Annual Attractions Survey shows historic properties experienced significant growth in visitor numbers in 2017. Visits to farm attractions also experienced strong growth in 2017, up 5% on the previous year. Historic houses and palaces along with visitor and heritage centres and places of worship all saw increases of 4% in 2017.
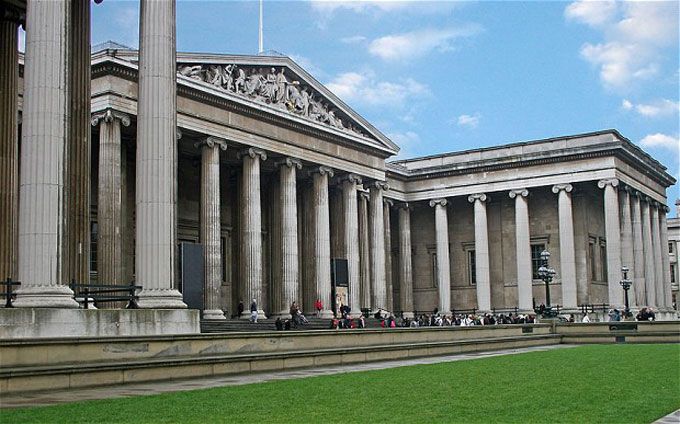
The British Museum was the most visited ‘free’ attraction in England in 2017 for the 10th consecutive year with nearly six million visitors, and the Tate Modern came a close second with more than five and a half million.
The Tower of London topped the list as the most visited ‘paid for’ attraction for the ninth year running with 2.8 million visitors and Chester Zoo came in second place with 1.9 million. .
Overall, visits to England’s attractions rose by 2% in 2017. Visitor attractions overall reported increased spending of 7% on 2016.
Overseas visits remained stable. Despite the challenging macro environment, with terror attacks and Brexit to contend with, attractions in England were able to maintain 2016 levels of overseas visitors. The 2017 International Passenger Survey showed an increase in inbound visits to the UK – up 4% compared to 2016.
Local / day trip visits saw a 2% increase on the previous year. At 9%, Yorkshire outperformed the overall average considerably – Hull’s role as the UK City of Culture for 2017 can be considered a key driver of this growth.
However, both child and schoolchildren admissions dropped back (by 7% and 2% respectively), driven by sites based in London and the South East, most likely due to security fears following the terror attacks.
Attractions based in London were most likely to have experienced a reduction in visitors, with the region reporting a 2% drop, following on from a 1% decrease felt in 2016.
Adult admission fees increased by an average of 4% in 2017 – slightly lower than the 6% reported in 2016, and more in line with the rate of inflation across this period (3.6%, Source: Bank of England).
Marketing spend at attractions continues to grow, with 2017 seeing a net increase of +7 (17% increasing spend, 10% decreasing spend), consistent with 2016. Visitor attractions that did report an increased marketing outlay were slightly more likely to have seen an increase in visitor numbers (6%, vs. 5% who reduced spend). Interestingly, this growth was driven by overseas visitors – with attractions who increased marketing expenditure reporting twice as much growth from this visitor type as those who reduced their budget (8% vs. 4%).
| RANK | Most visited PAID attractions | Most visited FREE attractions | ||
|---|---|---|---|---|
| Name of attraction | Number of Visitors in 2017 | Name of attraction | Number of Visitors in 2017 (E) = Estimate | |
| 1 | Tower of London | 2,842,970 | British Museum | 5,906,716 |
| 2 | Chester Zoo | 1,866,628 | Tate Modern | 5,656,004 |
| 3 | Flamingo Land Theme Park and Zoo | 1,691,083 | National Gallery | 5,229,192 |
| 4 | Windermere Lake Cruises, Bowness | 1,611,491 | Brighton Pier | 4,684,000 (E) |
| 5 | Stonehenge | 1,582,532 | NHM (South Kensington) | 4,434,520 |
| 6 | St Paul’s Cathedral | 1,571,197 | V&A South Kensington | 3,789,748 |
| 7 | Westminster Abbey | 1,547,001 | Science Museum | 3,251,634 |
| 8 | Royal Botanic Gardens, Kew Gardens | 1,485,337 | Somerset House | 3,223,350 |
| 9 | Roman Baths and Pump Room | 1,318,976 | Tate Britain | 1,777,877 |
| 10 | RHS Garden Wisley | 1,143,175 | British Library | 1,426,433 |
| 11 | ZSL London Zoo | 1,102,790 | National Portrait Gallery | 1,271,920 |
| 12 | Royal Academy of Arts | 1,049,962 | MAC Birmingham | 1,130,186 |
13 | Eden Project | 1,024,156 (E) | Imperial War Museum London | 992,690 |
| 14 | Houses of Parliament | 1,007,568 | Serpentine Gallery | 987,092 (E) |
| 15 | Hampton Court Palace | 984,862 | Horniman Museums and Gardens | 942,971 |
| 16 | Drayton Manor Park & Zoo | 973,797 | Ashmolean Museum | 937,568 |
| 17 | Shakespeare’s Globe | 924,220 | Merseyside Maritime Museum | 922,503 |
| 18 | Blenheim Palace | 918,776 | The Ice Cream Farm | 805,765 |
| 19 | Tower Bridge Exhibition | 812,196 | Oxford University Museum of Natural History | 768,487 |
| 20 | Yorkshire Wildlife Park | 792,053 | Museum of Liverpool | 737,120 |


